Eslan Labs uses an integrated depth to basement workflow for interpretation for hydrocarbon exploration fusing gravity, magnetics, and geology with petroleum system modeling. The workflow levers geological constraints by integrating the surface and basin structure, and the depth to basement interpreted from gravity and magnetics inversion.
Sediment thickness estimates are important in identifying what may be productive sedimentary basins, and to generate constraints for source rock maturity modeling and local thermal regimes. Our approach to map sediment thickness uses a depth to basement workflow that involves global compilations of open-source gravity and magnetic data.
Depth to basement Workflows
Density and susceptibility contrasts at basement-sediment boundaries typically produce anomalies that can be interpreted in terms of depth to basement. Data quality is variable, so our depth to basement workflow fuses the best of each of the data, compared to known geology.
Sediments have such low susceptibility that they can be considered magnetically transparent.
Basement rocks have a such higher susceptibility that the magnetic field at the surface is likely to reflect the basement. Depth-to-Moho estimation is an important part of Eslan Labs’ depth to basement workflow because a significant density contrast occurs at the Moho and must be removed in order to provide good depth to basement estimates.
A density contrast at the basement commonly exists, so gravity data may also be used to invert for depth to basement.
Terrain-corrected Bouguer anomalies are inverted to constrain Moho topography using the iterative procedures of Parker (1972) and Oldenburg (1974). In addition, density variations within sediments can produce a significant contribution to the observed gravity data.
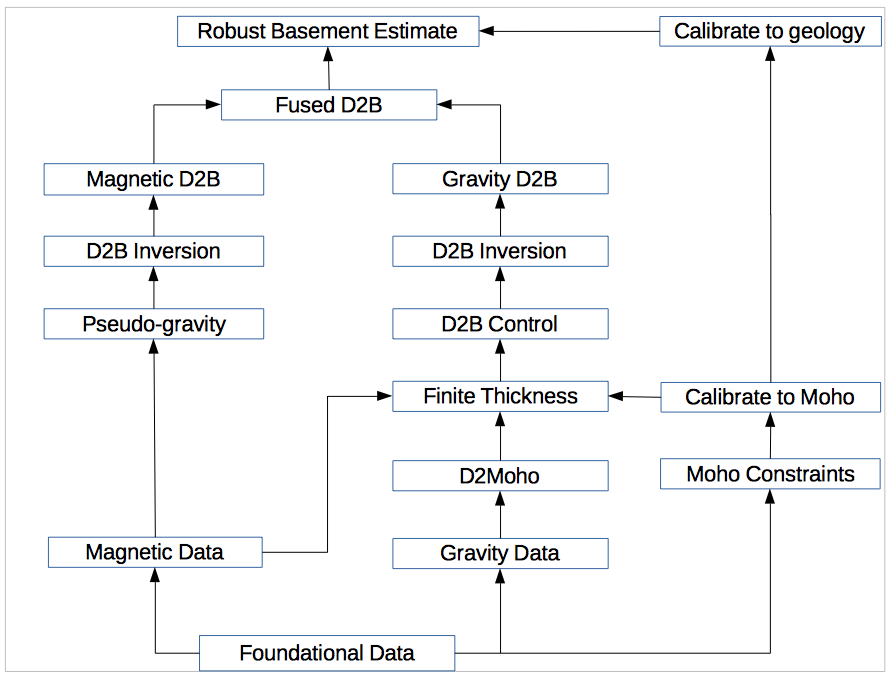
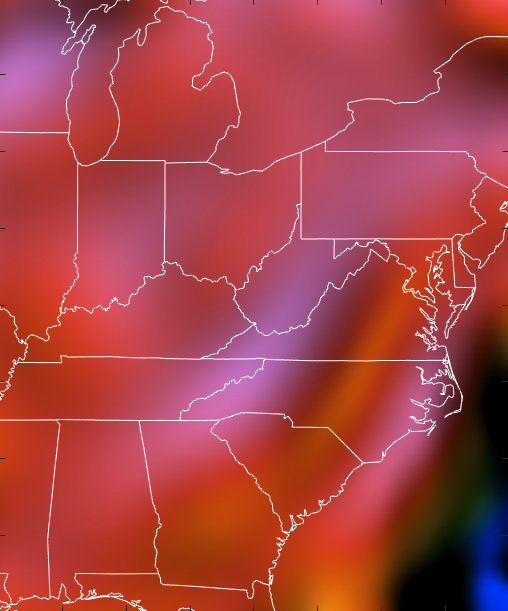
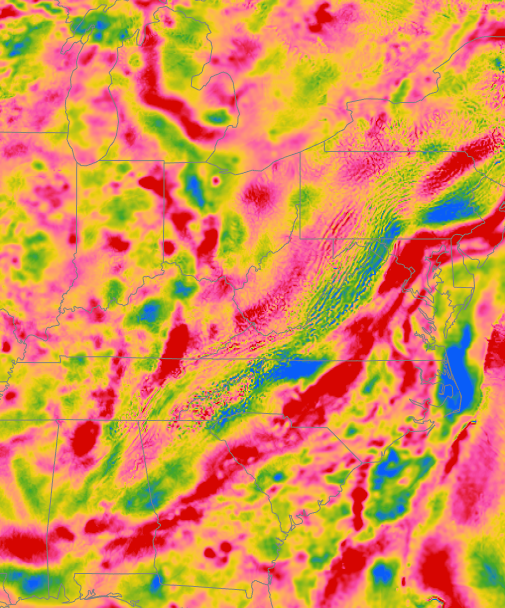
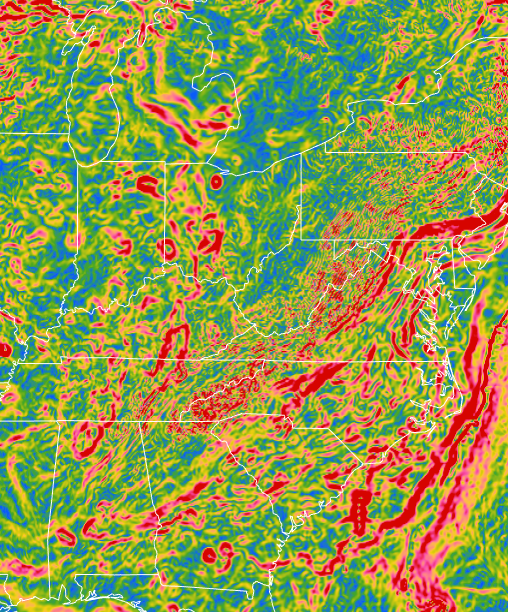
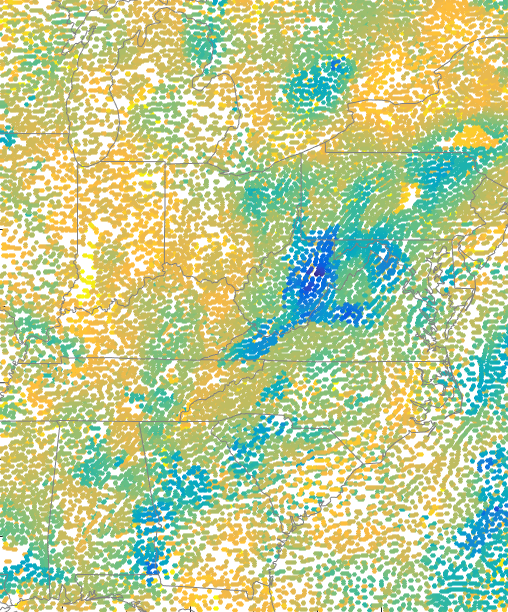
Depth to basement workflow illustrating the integration of gravity and magnetic field data with geological controls to produce a final composite depth to basement map. (Source: Eslan Labs)
Open Source Global Data Compilations
We use foundational data sets that comprise open-source global compilations of gravity and magnetic data, supplemented with proprietary data where available. These have been generated by merging many individual land, marine, airborne and satellite surveys in a consistent manner into global 1 km (gravity) and 1 km (magnetic) grids. If needed we can merge your proprietary potential field data sets into this base.
Data coverage varies, and selecting which to use and the weights to give them, depends on coverage, data resolution, and our expertize to judge how well they agree with known geological control.
Depth to Basement Workflow Using Fusion of Data Resources
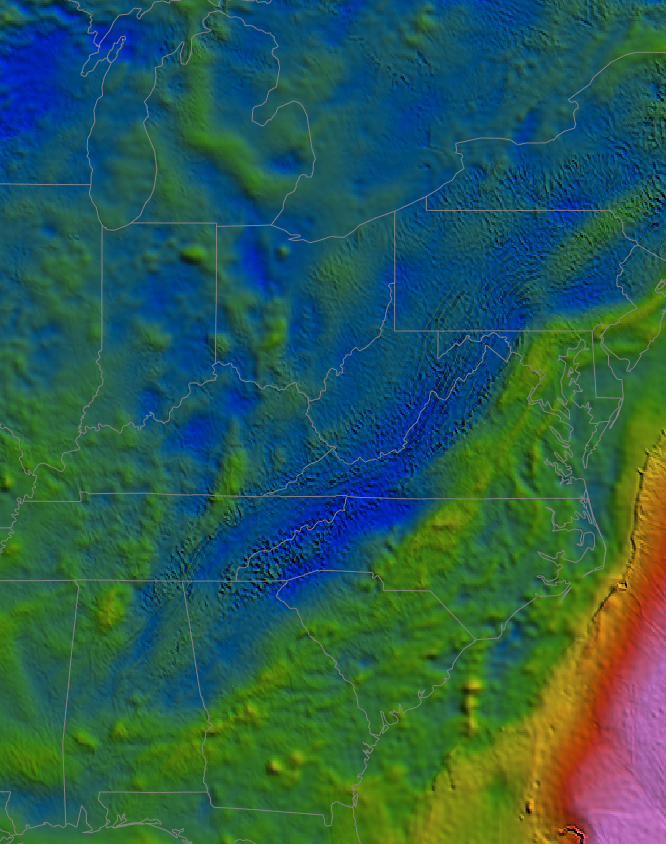
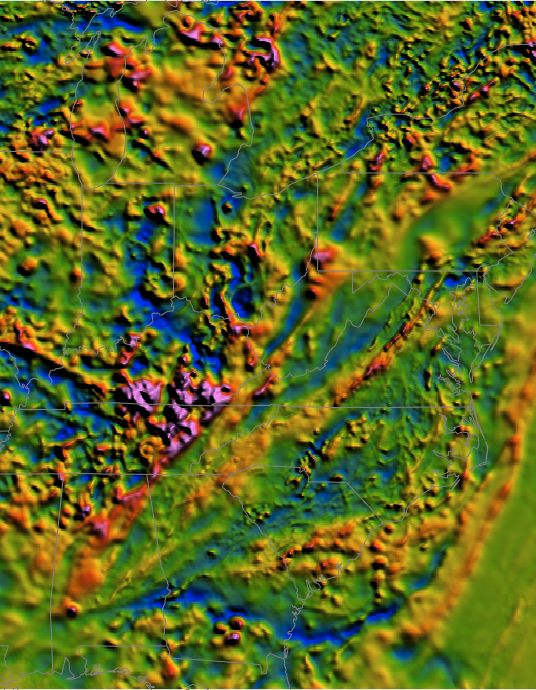
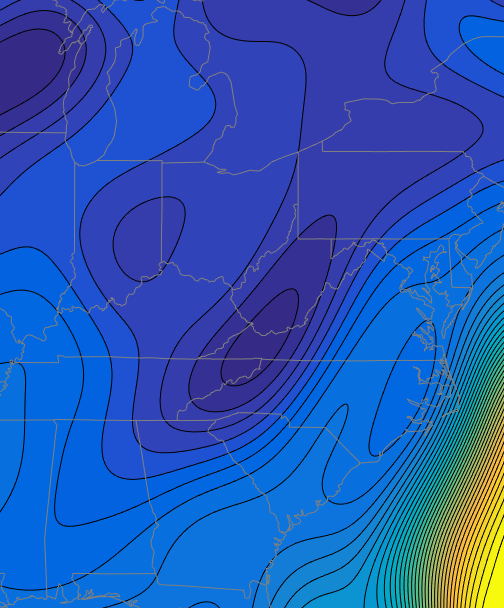
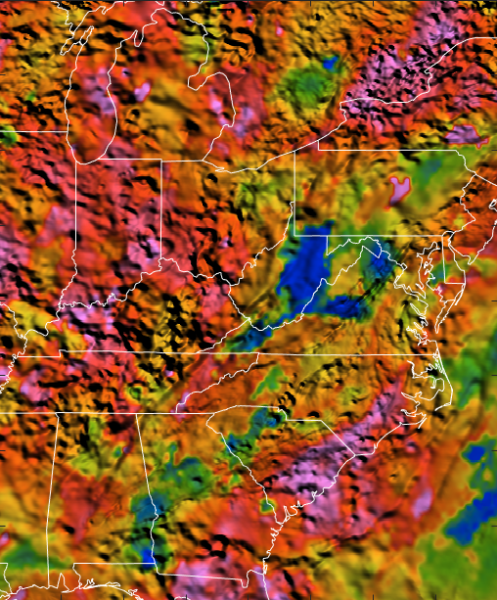
The Eslan Labs depth basement workflow incorporates both the magnetic data (providing a direct estimation of depth to basement) and the gravity data (depicting basement more indirectly), that we demonstrate with a frequently cited example from northeast USA.
The depth-to-basement workflow levers our proprietary database of depth to basement estimates, derived from published depth-to-basement, well data, structural geology, interpreted faulting, and high confidence magnetic data estimates. Our database is used as a control on the interpretation, and identifies regional variations that are incorporated into a final 3D inversion from the fused magnetic and gravity data. The global scope of the work means that the magnetic and gravity coverage will vary from area to area, and the final map products comprise elements from the magnetic and gravity interpretations.
The global scope of the depth basement workflow means that the magnetic and gravity coverage will vary from area to area, and the final map products comprise elements from the magnetic and gravity interpretations.
Basement structure
The Eslan Labs depth to basement workflow can also be used to predict regional-scale changes in basin geometry, structure segmentation, and patterns of sediment deposition. Interpretive maps of depth to basement terrain distribution, and structural fabric that characterize the nature of basement across a region are constructed using the above workflow based on integrating direct geological observations compared with potential field characteristics.
The gravity and magnetic fields are used to predict depth-to-basement terrain distribution, composition and structural fabric in areas where other datasets are unavailable. The common correlation between depth to basement structure orientation and basin geometry imply that basement structures have often influenced both basin evolution and sediment deposition through time.
Crustal Architecture
Our depth to basement workflow research is designed to gain insights into basement structure and its control on basin architecture and sedimentation patterns by deducing the size of the sedimentary basin and its subdivisions, identifying the structural framework and determining the thickness of sedimentary cover of the basement surface.
Several factors lead to local bias in basin thickness estimates from the depth to basement workflow. We have assumed a uniform Bouguer slab density of 2670 kg m3 throughout. Gravity anomalies over rock layers with densities differing from this assumption will have introduced spurious crustal thickness variations to our grid estimates, since over thick sedimentary layers, the Bouguer correction density probably exceeds the real density of the sedimentary layers.
There is value in joint interpretation of geological data with potential field data where the seismic interpretation has been complemented by integration of gravity and magnetic data with the primary objective of assessing depth to basement, structure and to identify the presence and extent of critical lithologies.
At Eslan Labs our experienced team of geoscientists provides state-of-the-art services to maximize the value of gravity and magnetic data sets for oil & gas, mining, or geothermal applications. We process and model gravity & magnetic data using our own state-of-the-art depth to basement workflows.
Useful Further Reading
Gunn PJ. 1997. Quantitative methods for interpreting aeromagnetic data: a subjective review. AGSO Journal of Australian Geology and Geophysics 17:2.
Flanagan, G., and Bain, J., 2013, Improvements in magnetic depth estimation: Application of depth and width extent nomographs to standard depth estimation techniques. First Break, 31, p.41–51.
Hackney R, Hall L & Köther N. 2012. Potential-field data for structural interpretation in the northern Perth Basin, Australia. Extended Abstracts, 22nd International Conference and Exhibition, Brisbane, 22‒29 February. Australian Society of Exploration Geophysicists.
Lee, M., Morris, B., and Uglade, H., 2010, Effect of signal amplitude on magnetic depth estimations. The Leading Edge, 29, p.672–677.
Milligan PR, Franklin R, Minty BRS, Richardson LM & Percival PJ. 2010. Magnetic Anomaly Map of Australia (Fifth Edition), 1:15 000 000 scale. Geoscience Australia, Canberra. Available at: https://www.ga.gov.au/products/servlet/controller?event=GEOCAT_DETAILS&catno=70282
Petkovic P, Fitzgerald D, Brett J, Morse M & Buchanan C. 2001. Potential Field and Bathymetry Grids of Australia’s Margins. ASEG Extended Abstracts 2001:1, doi:10.1071/ASEG2001ab109.
Salem, A., Blakely, R., Green, C., Fairhead, D., and Ravat, D., 2014a, Estimation of depth to top of magnetic sources using the local-wavenumber approach in an area of shallow Moho and Curie depth – The Red Sea. Interpretation, 2 (4), p.1–8.
Salem, A., Green, C., Cheyney, S., Fairhead, D., Aboud, E., and Campbell, S., 2014b, Mapping the depth-to-basement using inversion of pseudogravity: Application to the Bishop model and the Stord Basin, northern North Sea. Interpretation, 2 (2), p.T69–T78.
Spector A & Grant FS. 1970. Statistical models for interpreting aeromagnetic data. Geophysics 35: 293‒302.